buffer busy
waits
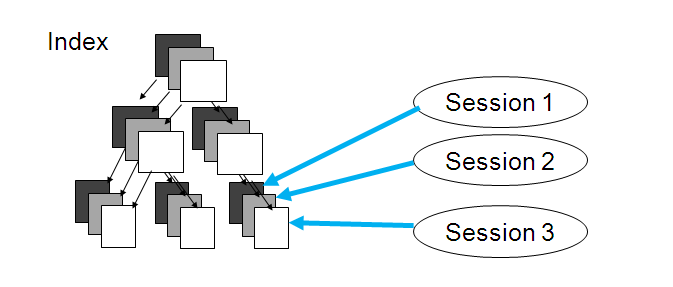
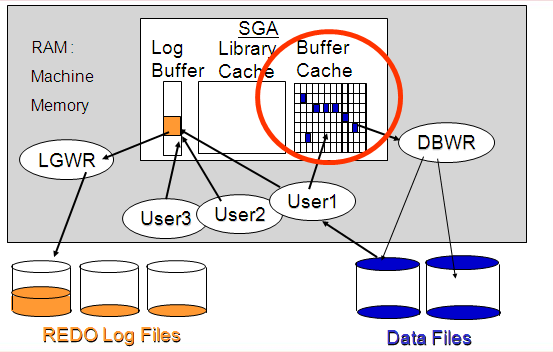
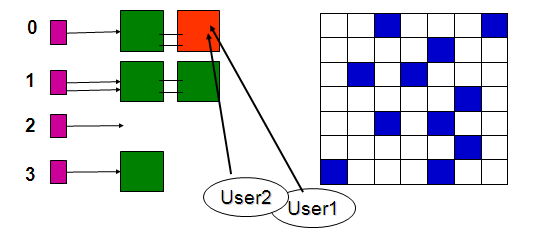
The buffer busy waits event occurs
when a session wants to access a data block in the buffer cache that is
currently in use by some other session. The other session is either reading the
same data block into the buffer cache from the datafile, or it is modifying the
one in the buffer cache.
On Oracle 9, the main reasons for buffer busy waits are
- 1) IO read contention (only Oracle 9i and below)
- 2) Insert Block Contention on Tables or Indexes
- 3) Rollback Segment Contention
control file
parallel write
The control file parallel write event
occurs when the session waits for the completion of the write requests to all of
the control files. The server process issues these write requests in parallel.
Starting with Oracle 8.0.5, the CKPT process writes the checkpoint position in
the online redo logs to the control files every three seconds. Oracle uses this
information during database recovery operation. Also, when you perform DML
operations using either the NOLOGGING or UNRECOVERABLE option, Oracle records
the unrecoverable SCN in the control files. The Recovery Manager (RMAN) records
backup and recovery information in control files.
db file parallel
read
Contrary to what the name suggests, the db
file parallel read event is not related to any parallel operation—neither
parallel DML nor parallel query. This event occurs during the database recovery
operation when database blocks that need changes as a part of recovery are read
in parallel from the datafiles. This event also occurs when a process reads
multiple noncontiguous single blocks from one or more datafiles.
db file parallel
write
Contrary to what the name suggests, the db
file parallel write event is not related to any parallel DML operation. This
event belongs to the DBWR process, as it is the only process that writes the
dirty blocks to the datafiles. The blocker is the operating system I/O
subsystem. This can also have an impact on the I/O subsystem in that the writes
may impact read times of sessions reading from the same disks.
db file scattered
read
The db file scattered read event is
posted by the session when it issues an I/O request to read multiple data
blocks. The blocks read from the datafiles are scattered into the buffer cache.
These blocks need not remain contiguous in the buffer cache. The event typically
occurs during full table scans or index fast full scans. The initialization
parameter, DB_FILE_MULTIBLOCK_READ_COUNT determines the maximum number of data
blocks to read.
db file sequential
read
The db file sequential read wait event
occurs when the process waits for an I/O completion for a sequential read. The
name is a bit misleading, suggesting a multiblock operation, but this is a
single block read operation. The event gets posted when reading from an index,
rollback or undo segments, table access by rowid, rebuilding control files,
dumping datafile headers, or the datafile headers.
db file single
write
The db file single write event is
posted by DBWR. It occurs when Oracle is updating datafile headers, typically
during a checkpoint. You may notice this event when your database has an
inordinate number of database files.
direct path
read
The direct path read event occurs when
Oracle is reading data blocks directly into the session’s PGA instead of the
buffer cache in the SGA. Direct reads may be performed in synchronous I/O or
asynchronous I/O mode, depending on the hardware platform and the value of the
initialization parameter, DISK_ASYNCH_IO. Direct read I/O is normally used while
accessing the temporary segments that reside on the disks. These operations
include sorts, parallel queries, and hash joins.
direct path
write
The direct path write wait event is
just an opposite operation to that of direct path read.
Oracle writes buffers from the session’s PGA to the datafiles. A session can
issue multiple write requests and continue processing. The OS handles the I/O
operation. If the session needs to know if the I/O operation was completed, it
will wait on direct path write event.
enqueue
An enqueue is a shared memory structure used by Oracle to
serialize access to the database resources. The process must acquire the enqueue
lock on the resource to access it. The process will wait on this event if the
request to acquire the enqueue is not successful because some other session is
holding a lock on the resource in an incompatible mode. The processes wait in
queue for their turn to acquire the requested enqueue. A simple example of such
an enqueue wait is a session waiting to update a row when some other session has
updated the row and not yet committed (or rolled back) its transaction and has a
lock on it in an exclusive mode.
free buffer
waits
The free buffer waits event occurs
when the session cannot find free buffers in the database buffer cache to read
in data blocks or to build a consistent read (CR) image of a data block. This
could mean either the database buffer cache is too small, or the dirty blocks in
the buffer cache are not getting written to the disk fast enough. The process
will signal DBWR to free up dirty buffers but will wait on this event.
latch free
The latch free wait occurs when the
process waits to acquire a latch that is currently held by other process. Like
enqueue, Oracle uses latches to protect data structures. One process at a time
can either modify or inspect the data structure after acquiring the latch. Other
processes needing access to the data structure must wait till they acquire the
latch. Unlike enqueue, processes requesting latch do not have to wait in a
queue. If the request to acquire a latch fails, the process simply waits for a
short time and requests the latch again. The short wait time is called “spin”.
If the latch is not acquired after one or more spin iterations, the process
sleeps for a short time and tries to acquire the latch again, sleeping for
successively longer periods until the latch is obtained.
library cache
pin
The
library cache pin wait event is
associated with library cache concurrency. It occurs when the session tries to
pin an object in the library cache to modify or examine it. The session must
acquire a pin to make sure that the object is not updated by other sessions at
the same time. Oracle posts this event when sessions are compiling or parsing
PL/SQL procedures and views.
library cache
lock
The library cache lock event is also
associated with library cache concurrency. A session must acquire a library
cache lock on an object handle to prevent other sessions from accessing it at
the same time, or to maintain a dependency for a long time, or to locate an
object in the library cache.
log buffer
space
The log buffer space wait occurs when
the session has to wait for space to become available in the log buffer to write
new information. The LGWR process periodically writes to redo log files from the
log buffer and makes those log buffers available for reuse. This wait indicates
that the application is generating redo information faster than LGWR process can
write it to the redo files. Either the log buffer is too small, or redo log
files are on disks with I/O contention.
log file parallel
write
The log file parallel write wait
occurs when the session waits for LGWR process to write redo from log buffer to
all the log members of the redo log group. This event is typically posted by
LGWR process. The LGWR process writes to the active log file members in parallel
only if the asynchronous I/O is in use. Otherwise, it writes to each active log
file member sequentially.
log file
sequential read
The log file sequential read wait
occurs when the process waits for blocks to be read from the online redo logs
files. The ARCH process encounters this wait while reading from the redo log
files.
log file switch
(archiving needed)
The log file switch wait indicates
that the ARCH process is not keeping up with LGWR process writing to redo log
files. When operating the database in archive log mode, the LGWR process cannot
overwrite or switch to the redo log file until the ARCH process has archived it
by copying it to the archived log file destination. A failed write to the
archive log file destination may stop the archiving process. Such an error will
be reported in the alert log file.
log file switch
(checkpoint incomplete)
The log file switch wait indicates
that the process is waiting for the log file switch to complete, but the log
file switch is not possible because the checkpoint process for that log file has
not completed. You may see this event when the redo log files are sized too
small.
log file switch
completion
This wait event occurs when the process is waiting for log
file switch to complete.
log file sync
When a user session completes a transaction, either by a
commit or a rollback, the session’s redo information must be written to the redo
logs by LGWR process before the session can continue processing. The process
waits on this event while LGWR process completes the I/O to the redo log
file.
SQL*Net message
from client
This wait event is posted by the session when it is waiting
for a message from the client to arrive. Generally, this means that the session
is sitting idle. Excessive wait time on this event in batch programs that do not
interact with an end user at a keyboard may indicate some inefficiency in the
application code or in the network layer. However, the database performance is
not degraded by high wait times for this wait event, because this event clearly
indicates that the perceived database performance problem is actually not a
database problem.
SQL*Net message to
client
This wait event is posted by the session when it is sending
a message to the client. The client process may be too busy to accept the
delivery of the message, causing the server session to wait, or the network
latency delays may be causing the message delivery to take longer.